Erik Schmidt · 12 September 2026
Updated Thermal Monitoring Protocols Roll Out Across Italian Cities Following Detailed Urban Climate Analyses
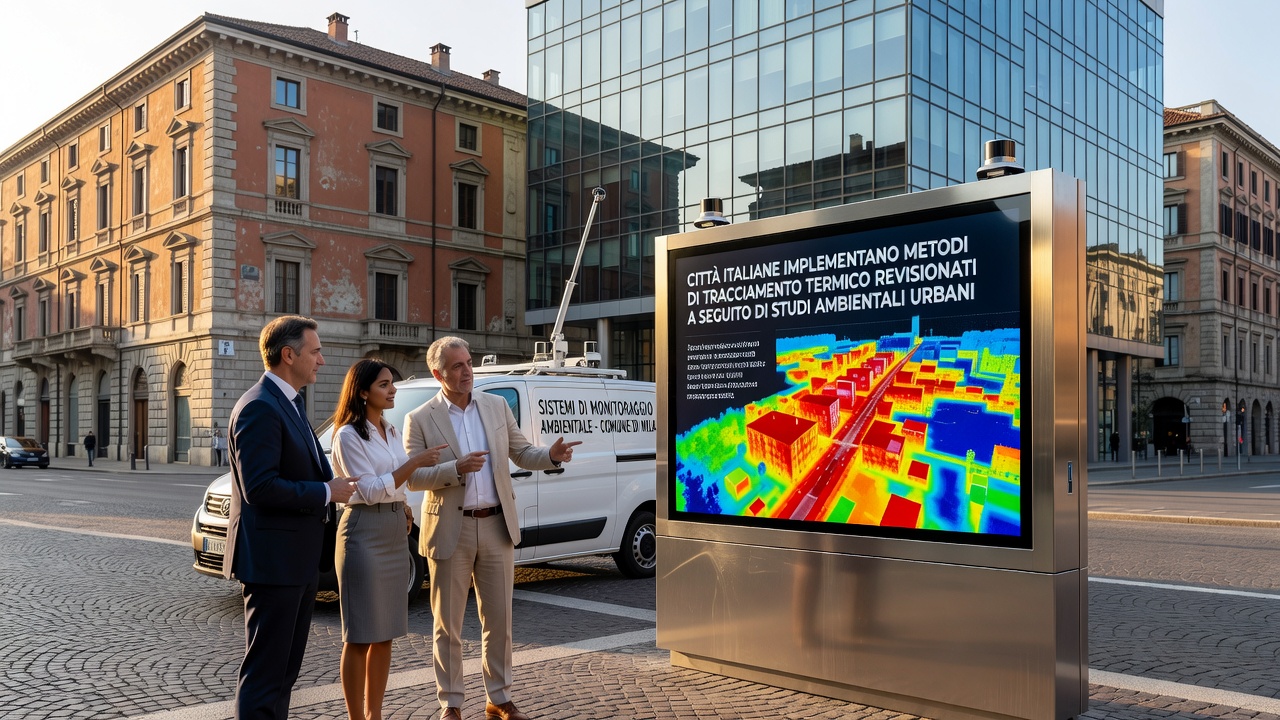
Italian municipalities have rolled out revised thermal tracking methods in response to comprehensive urban environmental studies conducted over the past several years, with initial implementations beginning in September 2026 across major centers including Milan, Rome, and Naples. Researchers compiled data on urban heat patterns, building material impacts, and green space effects, then used those findings to adjust sensor placement, data collection intervals, and integration with city planning software. The changes replace older static monitoring systems that relied on fixed weather stations with more dynamic networks capable of capturing microclimate variations at street level.
Previous Monitoring Approaches and Their Limitations
Earlier thermal tracking relied primarily on regional weather service stations positioned at airports and open fields, which provided broad temperature readings but missed localized heat buildup in dense neighborhoods. Data from those stations fed into annual reports yet offered limited granularity for real-time urban management decisions. Environmental researchers noted that such methods underestimated peak temperatures in areas with high concrete density and vehicle traffic, leading to gaps in heat mitigation planning. Cities therefore sought updated protocols that incorporate mobile sensors, satellite cross-verification, and building-integrated devices to produce more accurate spatial maps.
Key Findings from Recent Urban Environmental Studies
Multiple research teams examined temperature differentials between shaded pedestrian zones and exposed roadways in five Italian cities between 2023 and 2025. Their measurements showed that certain districts experienced afternoon spikes exceeding regional averages by several degrees, particularly where tree canopy coverage fell below twenty percent. Studies also documented how reflective roof coatings and permeable paving reduced surface heat retention during extended warm periods. These observations prompted recommendations for denser sensor grids and automated alerts tied directly to municipal maintenance schedules. According to data released by the European Environment Agency, Italian urban areas recorded measurable increases in summer heat intensity over the preceding decade, prompting the shift toward revised tracking frameworks.
Implementation Details Across Selected Cities
Milan began installing additional ground-level sensors along major transit corridors in September 2026, linking them to an existing digital twin model of the city center. Naples focused on harbor-adjacent neighborhoods where humidity and asphalt surfaces combined to elevate perceived temperatures, adding humidity-temperature combined units at bus stops and market squares. Rome expanded its network to include rooftop monitors on public buildings, allowing officials to correlate indoor-outdoor temperature relationships during heat events. Each city integrated the new data streams into existing emergency response systems so that maintenance crews could prioritize watering schedules and temporary shade structures based on live readings rather than historical averages.
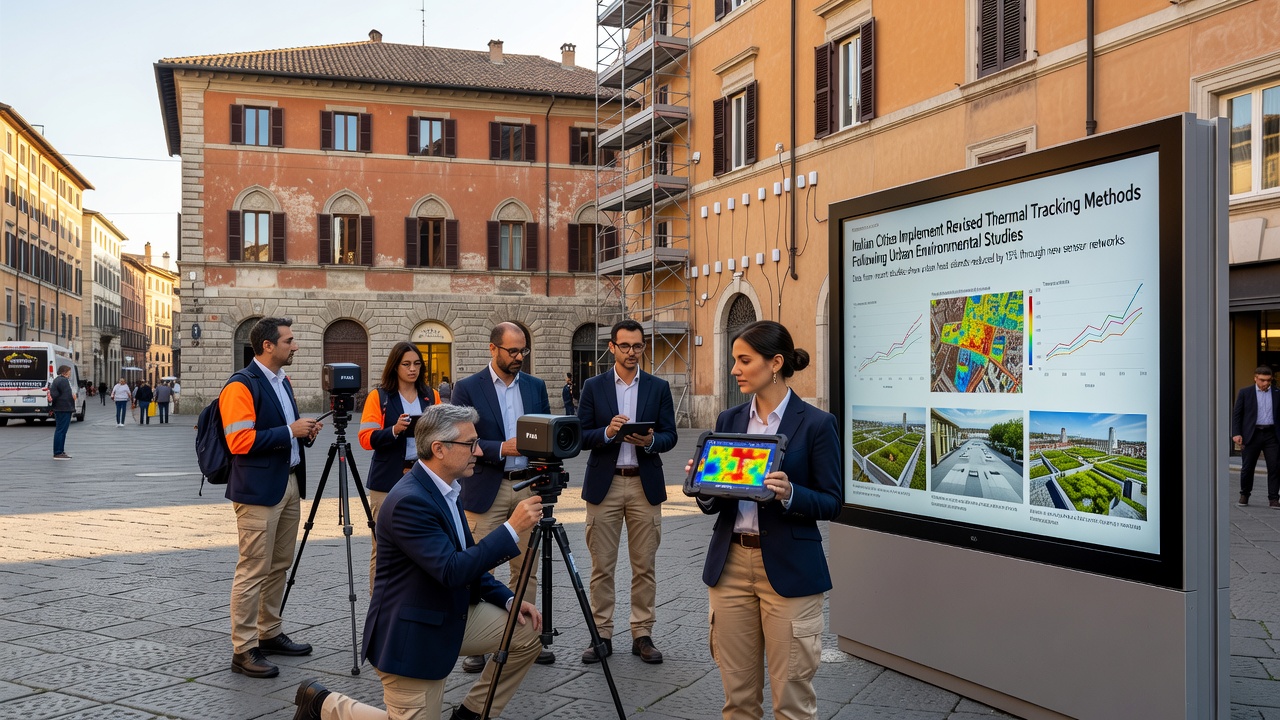
Engineers adjusted calibration routines to account for seasonal variations in solar angle and vegetation growth, reducing false positives that had previously triggered unnecessary resource deployments. Training programs for municipal staff emphasized interpretation of layered data sets that combine surface temperature, air temperature, and wind flow measurements. Pilot programs in smaller towns such as Bologna demonstrated that revised methods improved the accuracy of heat vulnerability maps used for public health outreach.
Technical Adjustments in Sensor Networks and Data Handling
The updated protocols call for sensors spaced at intervals no greater than two hundred meters in high-density zones, compared with the previous spacing of five hundred meters or more. Data transmission now occurs at fifteen-minute intervals during summer months rather than hourly summaries, enabling faster identification of emerging hot spots. Software platforms apply machine learning filters to distinguish between sensor drift and genuine temperature changes, while cross-referencing with satellite thermal imagery supplied through international partnerships. A report from the U.S. Environmental Protection Agency on urban heat island mitigation techniques provided comparative benchmarks that Italian teams adapted to Mediterranean climate conditions.
Integration with Broader City Planning Processes
Revised thermal data now informs decisions on park expansion, street tree selection, and building code updates in participating cities. Planners review weekly heat maps when prioritizing infrastructure repairs, and public works departments schedule reflective surface treatments based on areas showing the highest cumulative heat exposure. Coordination between environmental agencies and transportation authorities has increased, since traffic flow modifications can influence localized temperatures through changes in vehicle emissions and idling patterns. Observers note that these connections allow thermal tracking outputs to support multiple policy areas simultaneously rather than serving as standalone environmental reports.
Conclusion
Italian cities continue to refine these thermal tracking methods as new data accumulates from the expanded sensor networks installed since September 2026. The approach emphasizes continuous calibration against ground-truth measurements and regular updates to modeling software as urban layouts evolve. External sources such as university research repositories and regional environmental agencies supply ongoing validation datasets that help maintain consistency across different municipalities. This systematic update process reflects sustained attention to the spatial details of urban heat dynamics revealed through recent environmental studies.